The Pros & Cons of Different Rain Gauges. And does the Star rating really indicate how much fat your mince contains?
The Pros & Cons of Different Rain Gauges. And does the Star rating really indicate how much fat your mince contains? |
Does the Star rating really indicate how much fat your mince contains?When you buy mince you expect that the label matches what you are actually consuming. So do the Star ratings really reflect what fat content your mince contains. Read on to find out! The Pros and Cons of different types of rain gauges and how they operate!This month we are going to cover the various style of rain gauges that are available on the market and the pros and cons of each. | |||||||||||||||||||||||||||||||||||||||||||||||||||||||||||||||||||||||||||||||||
 Do the Star Ratings really reflect what you are getting?This month we are going to see whether or not the Star Ratings on a variety of supermarket minces adequately reflect the fat content they actually contain. As Star ratings define the allowable fat content within the mince we will be determining if the various minces in fact meet their requirements. 3, 4 and 5 Star Mince will be tested by boiling them in water and determining how much fat rises to the surface of a graduated cylinder. The fat rises to the surface as it is lighter than the proteins contained within the mince and as such we can determine an approximate fat content. Read on to find out how we did it and whether or not they lived up to expectations! | |||||||||||||||||||||||||||||||||||||||||||||||||||||||||||||||||||||||||||||||||
Equipment
Method 1) The 10cm square of wax paper was weighed using the SCCL501 – 500 x 0.1g Scale and was tarred to zero, the 3 star mince was then placed on the wax paper and a sample of 25g was produced using the SCCL501 – 500 x 0.1g Scale. This was repeated for the 4 and 5 star mince. 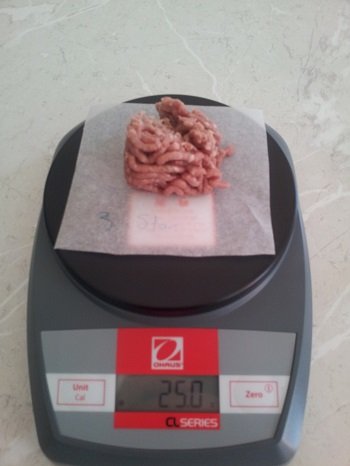 Figure 1: 3 Star mince being weighed prior to being mixed with water 2) The samples of mince were added to 1000ml beakers and 100ml of distilled water was added. The samples were broken up using a stirring rod. The samples were then heated over the hot plate until they were at a slow boil. They were boiled for 10 minutes and were stirred occasionally. 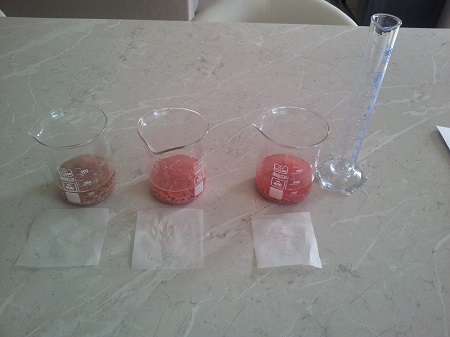 Figure 2: The three 25g samples mixed with 100g of water 3) After the samples had been boiled for 10 minutes they removed from the hot plate and were allowed to cool slightly until they could be handled without causing a burn. 4) The contents of the beakers were then poured into the graduated cylinder one after the other using the funnel and cheesecloth so that only the liquid was collected. The funnel and cylinder were cleaned between samples. 5) The sample was then left to sit for 5 minutes to allow the fat to rise to the top of the graduated cylinder. The amount of fat that rose to the top of the graduated cylinder was then recorded (1ml fat=1g fat approximately). This was then referenced against what was stated on the packaging with regards to fat content and recorded for reference. 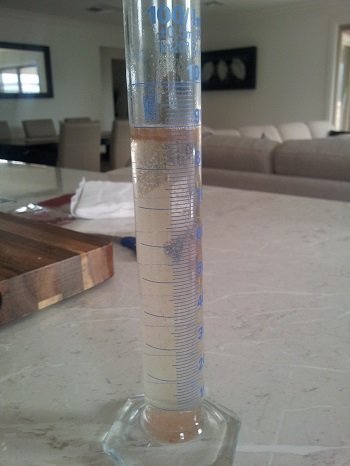 Figure 3: 4 Star Mince filtered into graduated cylinder 6) This process was then repeated for all samples a further two times and the results were averaged. This is also reflected in the results section. Results Test 1:
Table 1: This table shows the relative fat content of each of the 3 samples of 3 Star beef mince Test 2:
Table 2: This table shows the relative fat content of each of the 3 samples of 4 Star beef mince Test 3:
Table 3: This table shows the relative fat content of each of the 3 samples of 5 Star beef mince. Average of Results:
Table 4: This table shows the average relative fat content of each of the 3 samples of 3, 4 and 5 Star beef mince. Discussion and Conclusion The process of boiling the mince in water breaks down the structure of the mince and allows the lipids (fatty/oily substances) that are insoluble in water to separate from the proteins, and other molecules that make up the mince. Through filtering the samples to only obtain the liquid an estimate of the relative fat content could be made as the lipids rose to the surface as they are lighter than the water. An adequate reflection of fat content is 1ml=1g. The results show that all of the sample adequately reflect their Star rating and were consistent over the three tests. All of them were in fact below their stated fat content and the test proves that you get what you pay for when it comes to Star Ratings. If you would like to discuss this experiment further please contact one of our friendly Scientists via email or phone on 1300 737 871. | |||||||||||||||||||||||||||||||||||||||||||||||||||||||||||||||||||||||||||||||||
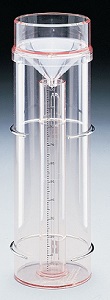
 The Pros and Cons of the various styles of rain gauges available in the market!Rain gauges are one of the most popular weather measuring devices. Everyone from farmers, to engineers, scientists and home users all have an interest in measuring rainfall. Whether it be for irrigation management, flood modelling, climate analysis or simply managing the vegie garden, measuring rainfall is important. There are a number of different styles of rain gauges and each of them have their pros and cons. Below we are going to investigate the most common types of rain gauges and their advantages and disadvantages. Standard analogue rain gaugeThe standard rain gauge is the version that most people are familiar with. They consist of a funnel that channels rain into a graduated cylinder. The rain is then measured by eye in mm off the graduated cylinder. The Australian standard rain gauge has a 203mm diameter circular funnel. Pros
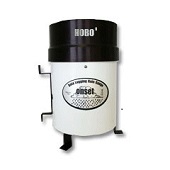
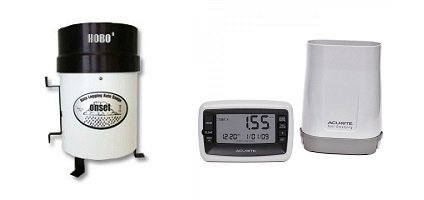
 Digital tipping bucket rain gauge Digital tipping bucket rain gaugeWith the advent of digital weather stations, tipping bucket rain gauges have become more and more popular. They have a funnel similar to a standard rain gauge, but the funnel is directed onto 1 of 2 buckets on a seesaw like structure. When one bucket fills up, it tips over, and allows the second bucket to be filled up. Each time the “seesaw” tips an electrical pulse is generated and an amount (typically 0.2mm) is registered. With wireless weather stations, this data can be sent immediately to a display, for near instantaneous measurements of rainfall. For datalogging stations, the exact time of the rainfall and the intensity of rainfall over time can be measured. Pros
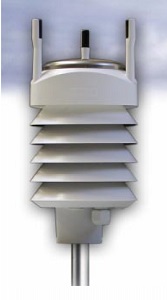
 Impact rain sensor Impact rain sensorImpact rain sensors are a relatively new method of measuring rainfall. They typically have a round stainless steel cover around 90mm in diameter, and measure the acoustic signal of each rain drop that hits the sensor. Larger rain drops create a bigger sound, and smaller rain drops create a smaller sound. This is then processed using an algorithm which is used to calculate the intensity and direction of rainfall. Hail is also detected separately as the sensor can distinguish between the different sounds made by hail compared to rain. Pros
 With the wide variety of rain gauges out there, it is important to choose the right one for your application. If you want help choosing the best rain gauge for your requirements, or just have some general questions, please feel free to contact one of our scientists via email or phone on 1300 737 871. | |||||||||||||||||||||||||||||||||||||||||||||||||||||||||||||||||||||||||||||||||