What level of g-force is a parcel exposed to when it is sent across the country?
What level of g-force is a parcel exposed to when it is sent across the country? |
 | This month the Instrument Choice team wanted to see how much shock a parcel is exposed to over the course of a journey from Adelaide to Melbourne and back again. We wanted to see if the levels the parcel was exposed to could potentially cause damage along with seeing how well a courier company treats its packages. To do this a Shock logger was sent to a company in Victoria and they then returned it to us. From this the g-force the logger was exposed to in the X, Y and Z axis whilst being transported was investigated to establish risk and exposure. | |
Equipment Method Step 1 - Setting the logger up The logger was connected to the computer by way of the IFC200 interface. It was set to record at a 30 second interval and then set to start at 5:00pm (approximately when our courier arrives).
Step 2 - Package the logger ready for shipping The logger was packaged into a small box and foam pellets were placed around the logger to prevent it being dented during transit.
Step 3 - The logger was transported The logger was picked up by the courier and was transported to Victoria, it stayed here for a fortnight and was then returned to us.
Step 4 - The logger was downloaded The logger was then connected to the PC by way of the IFC200 interface and the data was downloaded into Madgetech's propriety software and then into Excel for further analysis. The data was then compared to tracking we received from the relevant courier companies. The results can be seen below.
Results 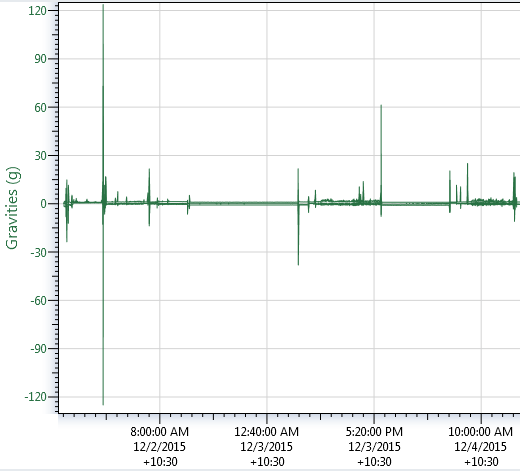 Figure 1: Shows the g-force the logger was subjected to during shipping to Victoria
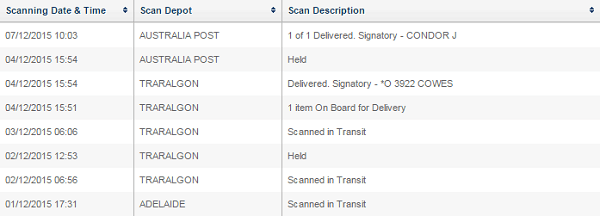 Figure 2: Shows where the parcel was over time on its way to Victoria
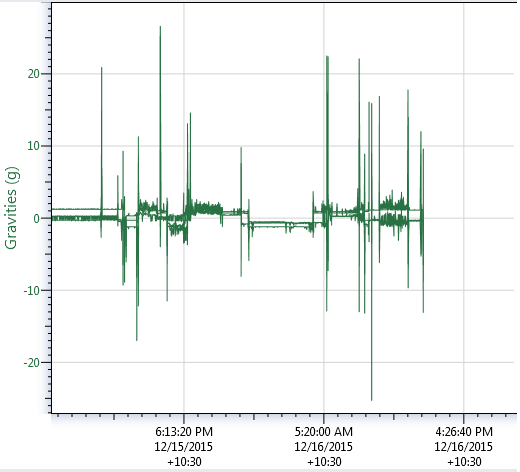 Figure 3: Shows the shock the logger was exposed to on its return journey from Victoria to us
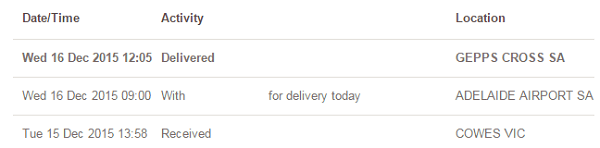 Figure 4: Shows where the parcel was over time on its way back to us
Discussion The results show that the parcel was subjected to a significant amount of shock on both its journey to Victoria and its return journey to us here at Instrument Choice. From the data you can clearly see when the parcel is in transit versus when it is being held or at the depot. The data almost lines up perfectly with the tracking information as to when it is in transit or being scanned which gives great insight into when the parcel is undergoing the most stress. The parcel underwent a considerable amount of shock during both journeys, however the most concerning reading was the whopping 120g the parcel was subjected to on its way to Victoria. This appears to have occurred when the parcel was 'scanned in' and this may suggest the parcel was dropped onto a hard surface causing a massive spike in the g-force it was exposed to. This is because after a free fall from a height (h) the shock on an object during impact is (h/d) g, where d is the distance covered during the impact. For example, a stiff and compact object dropped from 1 m that impacts over a distance of 1 mm is subjected to a 1000 g deceleration. This shows that the parcel may have been dropped from a substantial height coming to a stop in a short time frame producing the high g-force. As our parcel was packed well and had cushioning it was not damaged in transit. However, if a parcel was poorly packaged or didn't have any protection it could potentially be damaged under the conditions we saw our parcel exposed to. The rule of thumb with any parcel should be to package it well and ensure it has some cushioning as this will prevent it from being damaged during transit. This is why we here at Instrument Choice always ensure our parcels are well wrapped and protected to ensure they arrive at your destination in perfect shape. If you would like to discuss this experiment further please feel free to contact one of our friendly Scientists via email or phone on 1300 737 871. | ||
See our other newsletter articles here!
Contact our expert scientists now to get the right meter or data logger to suit your needs and discuss your project.
Phone: 1300 737 871
Email: [email protected]