Using the Pulse Scaling Assistant in HOBOware!
Using the Pulse Scaling Assistant in HOBOware! |
| Onset Computer Corporation, who make the HOBO range of dataloggers, have recently
changed their HOBOware-lite software from a paid option to a free option and rebadged it as
HOBOWare. They have also enabled some of the professional features including a pulse scaling
assistant to allow you to use the free software with their range of pulse loggers. In this month’s
article we will go through the Pulse Scaling Assistant showing you how to get the most out of your
data logger. The most common applications for using a pulse logger are for measuring the output from a water flow meter and contact closures in tipping bucket rain gauges. For these applications, the pulse scaling assistant is useful in allowing you to convert the pulses into something more tangible like litres of water or mm of rainfall. Below we will go through setup of a UX90-001 to show you how to set it up for a water meter. To start with connect the logger and choose “launch device” and you will be presented with the following screen. We have entered “Flow” as the type of reading and chosen to show the unit as “L”. 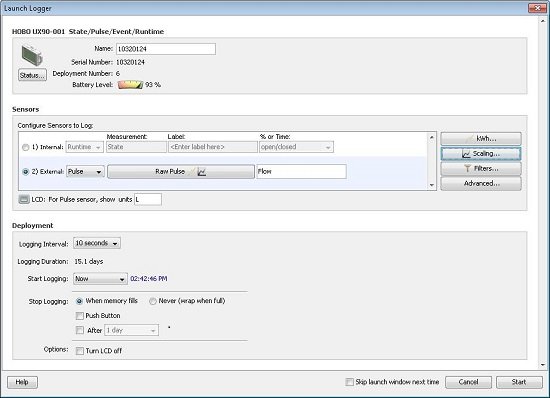 Figure 1: Setting up the UX90-001 for flow measurement
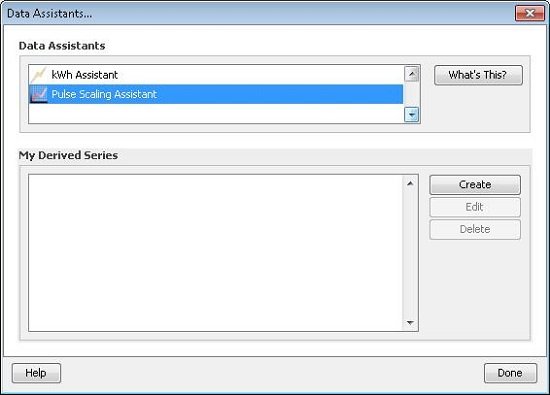 Figure 2: Managing the scaling assistant
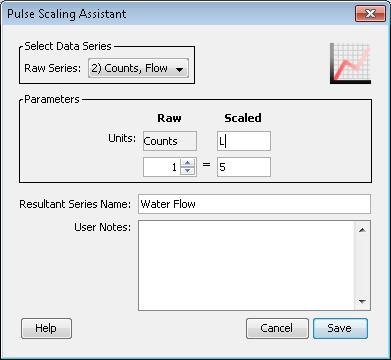 Figure 3: Creating your scaled unit
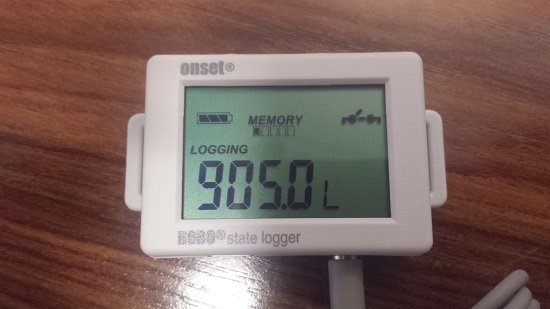 Figure 4: UX90-001 now displaying its scaled units
Once you have finished recording, you can connect the unit back to a computer to download your results: 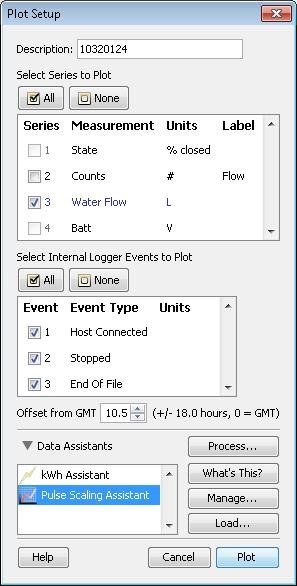 Figure 5: Downloading your scaled results
Once you plot the data you will be able to see how the flow (or whatever you were measuring) has changed over time. There are also options to filter the data to show daily totals etc.  Figure 6: Scaled results over time
If you would like to discuss our range of pulse dataloggers further or have any further questions please feel free to contact one of our friendly Scientists via email or phone on 1300 737 871. |
See our other newsletter articles here!
Contact our expert scientists now to get the right meter or data logger to suit your needs and discuss your project.
Phone: 1300 737 871
Email: [email protected]