The difference between Accuracy, Precision and Resolution PLUS our experiment into the best coffee cups for keeping your coffee hot!
The difference between Accuracy, Precision and Resolution PLUS our experiment into the best coffee cups for keeping your coffee hot! |
The difference between Accuracy, Precision and ResolutionPLUS our experiment into the best coffee cups for keeping your coffee hot!The Instrument Choice staff love their coffee, but they often get distracted chatting to customers and the coffee goes cold, so Daniel, one of our Scientific Sales Consultants wondered, what would be the best cup to keep the coffee hot the longest. He did the experiment using our product of the month, the ICBTM-4208SD 12 Channel Thermocouple Data Logger, the experiment details and results are below It is time to set the record straight..... There is a lot of confusion with customers about the difference between accuracy, precision and resolution. To clear it up Tim our Client Services Manager and Scientist has detailed below exactly why they are different and why it is important to know the difference. Please remember if you have any questions regarding tests you need to conduct or specific instrumentation please give us a call on 1300 737 871. Until next month…Tyson Grubb | |||||||||||||||||||||||||||||||||||||||||||||||||||||||||||||||||||||||||||||||||||||||||||||||||||||||||||||||||||||||||||||||||
 Experiment The Best Cup To Keep Your Coffee Warm.Having a coffee that stays warm for the time you take to drink it can be a frustrating prospect. By the time you get to the bottom of your cup there is always a vial cold dredge that no one enjoys drinking. The optimum temperature for black coffee with consumers according to the Journal of Food Science is around 60°C; however there are consumers that prefer it hotter than this. For this month’s experiment we are going to test a variety of cups to see which one keeps coffee the warmest for the longest period once brewed and poured, we will also see which ones temperature had the smallest temperature differential over the period; read on to find out the results. | |||||||||||||||||||||||||||||||||||||||||||||||||||||||||||||||||||||||||||||||||||||||||||||||||||||||||||||||||||||||||||||||||
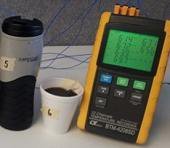
Materials
Method All cups were setup in a row and the TP-01 thermocouple were fitted halfway down the cup ensuring they were not touching the sides, and were fitted in place using masking tape. The thermocouples were then connected to the logger and the logger was setup to log at a 5 minute interval on a push button start. 1400ml of water was then boiled in a kettle. This was then decanted into a coffee plunger and 1200ml of coffee was prepared. 200ml of coffee was poured into each of the cups and the logger was started. The lids were then fitted to the cups that had lids. The cups were left for half an hour and results were then downloaded to a PC for analysis. The results are shown below. 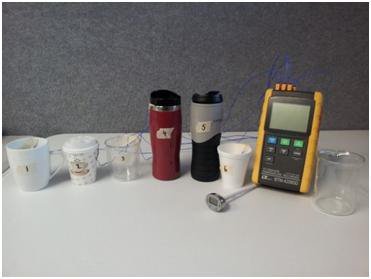 Figure 1: All cups with thermocouples installed ready for testing to begin 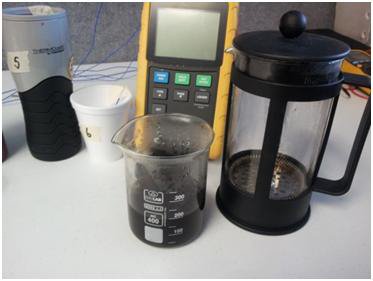 Figure 2: 200ml of coffee, ready to be poured into the cups 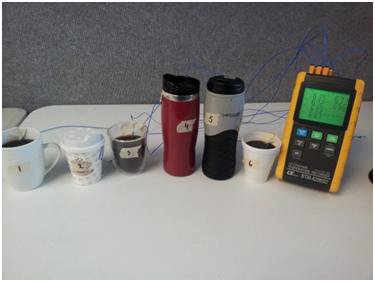 Figure 3: The ICBTM-4208SD happily logging the 6 cup's temperatures Results
Table 1: Temperature over time for different cup types
Table 2: Temperature difference over time 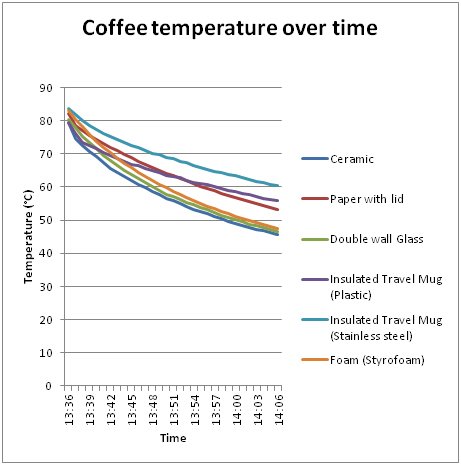 Graph 1: Coffee temperature over time based on cup type Discussion All of the cups under test showed the most significant temperature drop in the first 5 minutes. The cup with the lowest temperature drop in the first 5 minutes was the plastic insulated travel mug, dropping 6.1°C, whilst the double wall glass had the highest temperature drop of 10.7°C. All of the cups continued to drop in temperature over the course of measurement; however the drop became slower after the 15 minute mark. The three cups that had lids significantly outperformed those that didn’t with regards to their drop in temperature over the measurement interval; the paper cup with the lid was the worst performer of the cups with lids dropping 28.8°C, whilst the insulated travel cups performed similarly over the 30 minute period dropping 23.2°C for the stainless steel option and 23.6°C for the plastic option. The cups without lids were very similar in their overall temperature drop over the period. The worst performer was the foam (Styrofoam) cup dropping by 35.6°C, whilst the ceramic and double wall were very similar at 33.7°C and 33.5°C respectively. The three cups with lids also managed to sustain a higher final temperature than those without lids. The stainless steel insulated cup finished with the highest temperature of 60.3°C, whilst the ceramic cup finished with the lowest temperature of 45.6°C. It is interesting to note that the cups without lids dropped to below the 60°C temperature that consumers desire when drinking coffee after 15 minutes. Whilst the cups with lids managed to hold above 60°C until after the 20 minute mark. Conclusion The results from our tests show that cups with lids perform significantly better at keeping a coffee warm over a period of time. This is likely due to there being less effect by the ambient air temperature on the temperature of the liquid and that heat is trapped and takes longer to escape. In saying this, this is generally not a possibility at a restaurant, café or establishment that will serve you coffee in a cup with no lid. If this is the case then your coffee should stay warm enough for it to be enjoyable for 15 minutes without a lid as it will be close to the average optimum temperature. If you take a significant period to enjoy your coffee and want it to remain warm for an extended period the best option will be an insulated travel cup with a lid. Have your say! What else do you think we could have tested? What effect do you think milk being added to the coffee would have on the results? Do you think sugar would affect the results? Write an email to Daniel at [email protected] or give us a call on 1300 737 871. | |||||||||||||||||||||||||||||||||||||||||||||||||||||||||||||||||||||||||||||||||||||||||||||||||||||||||||||||||||||||||||||||||
 Accuracy, Precision and Resolution. What is the difference?The terms “accuracy”, “precision” and “resolution” are often used interchangeably, however they have very different meanings, and knowing the difference could affect the way you choose a product. Below we will explain the terms and go through the difference between them and the common errors that can result of their misuse. ResolutionResolution is the smallest increment that an instrument can measure. For example, a low cost thermometer might have a resolution of 1°C (i.e. it reads 56°C or 57°C) whereas a higher cost unit might have resolution of 0.01°C (i.e. read 56.24°C or 56.66°C). AccuracyAccuracy is a measure of how close the reading that the meter takes is compared to the actual value. For example if you used two thermometers to measure the temperature of some water which was 75.00°C and thermometer 1 gave a reading of 75.2°C and thermometer 2 gave a reading of 75.7°C, then thermometer 1 would be more accurate as it is closer to the real value. It is worth noting that although a unit may have higher resolution, it is not necessarily more accurate. i.e if you had another thermometer and it measured the 75.00°C water at 75.81°C, it would have the best resolution of the 3 thermometers, but it is the least accurate as it’s reading is the furthest away from the correct value. PrecisionPrecision is in some ways the trickiest of the three to get your head around. It is a measure of the how repeatable and reliable the measurements taken by the meter are. For example, if you used the same thermometer to take 5 measurements of the 75.00°C water bath and it read 75.53°C, 75.54°C, 75.53°C, 75.54°C and 75.54°C, then it would be classed as quite precise as the measurements are all very close to each other. If you used another thermometer and it read 75.10°C, 74.92°C, 74.95°C, 75.04°C and 75.13°C, it would be classified to be not as precise as the first thermometer as the readings are more spread out, however, the accuracy of the second unit is better as the readings are closer to the actual value. Common mistakes:
If you have any questions about resolution, precision and accuracy feel free to email me at [email protected]. | |||||||||||||||||||||||||||||||||||||||||||||||||||||||||||||||||||||||||||||||||||||||||||||||||||||||||||||||||||||||||||||||||